Why one climate needs several numbers
Köppen–Geiger classes (Peel et al., 2007) sort the world by monthly temperature and rainfall through the whole year. They say whether a place is Mediterranean, oceanic or humid subtropical, which is where our article on the three major wine climates starts. They do not say how fast grapes ripen, so viticulture also uses indices built for one growing season.
Each index compresses the same daily temperature record in a different way. Hall and Jones (2010) calculated four indices for Australian geographical indications and found that the same region can fall into different classes depending on which index is used. The sections below take the main scales in turn.
The Winkler index: degree-days above 10 °C
The Winkler scale was published in 1944 by Amerine and Winkler of the University of California, Davis, to divide California into heat regions. Its degree-days are the sum, from 1 April to 31 October (northern hemisphere), of the daily mean temperature above 10 °C (50 °F); a day at or below 10 °C adds nothing.
The five regions are defined in degree-days Fahrenheit: Region I up to 2500, II 2501–3000, III 3001–3500, IV 3501–4000 and V above 4000. Hall and Jones give the same boundaries in degrees Celsius as 1389, 1667, 1944 and 2222.
The strength of the scale is its simplicity: it needs only a daily mean. That is also its limit. Averaging day and night means a hot afternoon followed by a cold night can score like a mild day with a mild night, and the scale knows nothing about rainfall or day length.
The Huglin index: afternoon heat and day length
The Huglin heliothermal index was proposed by Huglin in 1978 and later defined in an OIV resolution (2012). It sums, from 1 April to 30 September in the northern hemisphere (1 October to 31 March in the south), half of the sum of the daily mean and the daily maximum, each taken above 10 °C, and multiplies the total by a latitude coefficient k: 1.02 at 40–42 degrees, 1.03 at 42.1–44, 1.04 at 44.1–46, 1.05 at 46.1–48 and 1.06 at 48.1–50. The resolution gives no coefficient outside 40–50 degrees.
Because it uses the daily maximum, it rises faster than Winkler in sunny places with hot afternoons. Tonietto and Carbonneau (2004) grade it from very cool (up to 1500) through cool (1500–1800), temperate (1800–2100), temperate warm (2100–2400) and warm (2400–3000) to very warm (above 3000). The German weather service DWD names 1700 to 1800 for Riesling and Pinot noir. The index is silent about nights and rainfall.
Growing season average temperature, with six regions
Growing season average temperature (GST) is the mean temperature from April to October in the northern hemisphere (October to April in the south). Jones groups it as cool (13–15 °C), intermediate (15–17 °C), warm (17–19 °C) and hot (19–24 °C), and puts the range for high-quality wine at about 13–21 °C.
Values from Jones’s tables show the spread: Mosel 13.0 °C, Alsace 13.1, Champagne 14.5, Burgundy (Côte) 15.3, Margaret River 18.6 and Barossa 19.9 °C. They depend on the years averaged, and the table’s reference period should be checked before the numbers are compared with newer data. A seasonal mean is easy to read, but it hides peaks of heat and cold nights.
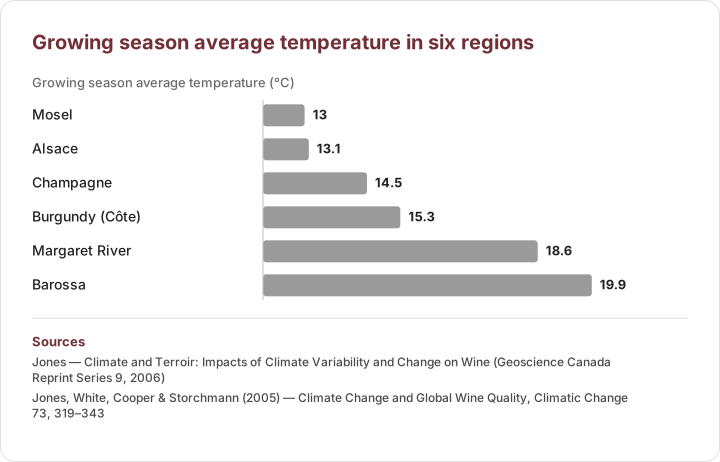
Diagram drawn from sourced data
Values from Jones’s tables; confirm the averaging period of those tables before comparing with newer data. Jones’s groups: cool 13–15, intermediate 15–17, warm 17–19, hot 19–24 °C.
- Jones puts the range for high-quality wine at about 13–21 °C.
Growing season average temperature (°C)
- Mosel: 13 °C
- Alsace: 13.1 °C
- Champagne: 14.5 °C
- Burgundy (Côte): 15.3 °C
- Margaret River: 18.6 °C
- Barossa: 19.9 °C
Cool nights, water and the multicriteria system
Tonietto and Carbonneau (2004) argued that heat alone is not enough and combined three indices in a multicriteria system (MCC): the Huglin index, a Cool Night Index (CI) and a Dryness Index (DI). They applied it to 97 regions in 29 countries.
CI is the mean minimum temperature of September (March in the southern hemisphere). Its classes are very cool nights up to 12 °C, cool nights above 12 up to 14 °C, temperate nights above 14 up to 18 °C and warm nights above 18 °C. DI is a potential soil water balance after Riou, from very dry to humid.
Diurnal range, the daily maximum minus the minimum, is not an index of its own in this system; CI captures the night side of it. The authors link cool nights to colour and aroma in red varieties.
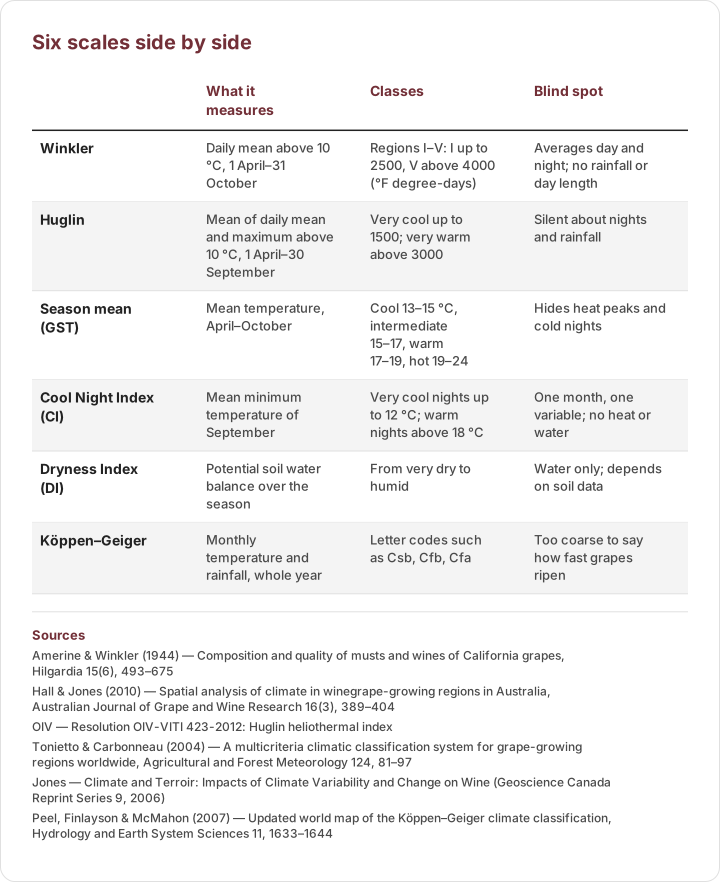
Diagram drawn from sourced data
What each scale counts, how it classes places, and what it cannot see. The blind spots are our reading of the definitions, not figures from the sources.
| What it measures | Classes | Blind spot | |
|---|---|---|---|
| Winkler | Daily mean above 10 °C, 1 April–31 October | Regions I–V: I up to 2500, V above 4000 (°F degree-days) | Averages day and night; no rainfall or day length |
| Huglin | Mean of daily mean and maximum above 10 °C, 1 April–30 September | Very cool up to 1500; very warm above 3000 | Silent about nights and rainfall |
| Season mean (GST) | Mean temperature, April–October | Cool 13–15 °C, intermediate 15–17, warm 17–19, hot 19–24 | Hides heat peaks and cold nights |
| Cool Night Index (CI) | Mean minimum temperature of September | Very cool nights up to 12 °C; warm nights above 18 °C | One month, one variable; no heat or water |
| Dryness Index (DI) | Potential soil water balance over the season | From very dry to humid | Water only; depends on soil data |
| Köppen–Geiger | Monthly temperature and rainfall, whole year | Letter codes such as Csb, Cfb, Cfa | Too coarse to say how fast grapes ripen |
Sources
- Amerine & Winkler (1944) — Composition and quality of musts and wines of California grapes, Hilgardia 15(6), 493–675
- Hall & Jones (2010) — Spatial analysis of climate in winegrape-growing regions in Australia, Australian Journal of Grape and Wine Research 16(3), 389–404
- OIV — Resolution OIV-VITI 423-2012: Huglin heliothermal index
- Tonietto & Carbonneau (2004) — A multicriteria climatic classification system for grape-growing regions worldwide, Agricultural and Forest Meteorology 124, 81–97
- Jones — Climate and Terroir: Impacts of Climate Variability and Change on Wine (Geoscience Canada Reprint Series 9, 2006)
- Peel, Finlayson & McMahon (2007) — Updated world map of the Köppen–Geiger climate classification, Hydrology and Earth System Sciences 11, 1633–1644
What the numbers miss, and how growers use them
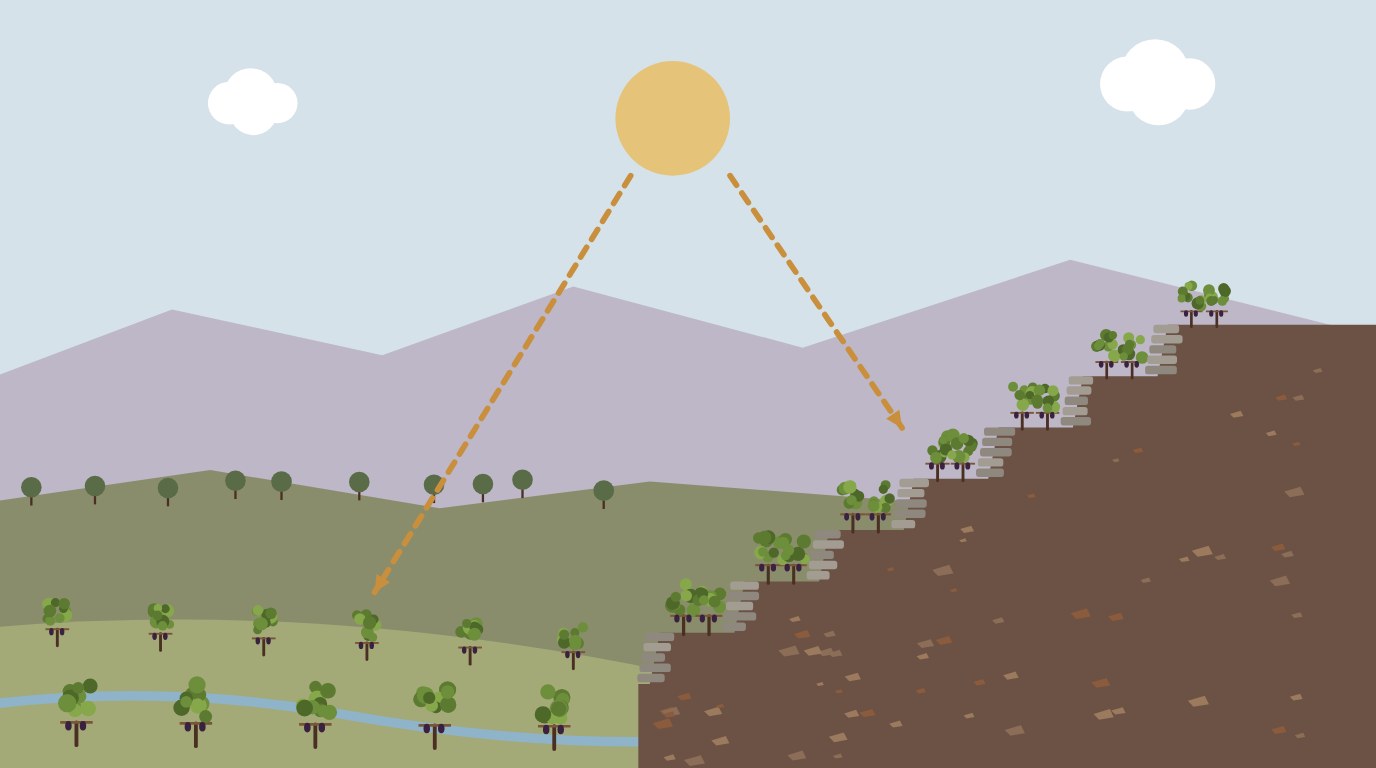
A regional number hides places inside the region. A temperature-based zoning of Bordeaux (Bois et al., 2018) found up to 20 days’ difference in the date grapes reach the same ripeness between sites. DWD notes that slopes facing south, south-west and south-east are about 1.5–2 K warmer than flat ground, which adds 150 to 300 degree-days between April and September. None of the scales above includes soil, wind, frost risk or how the vines are managed.
Growers use the indices as a first filter: to judge which varieties suit a site (Jones gives about 14.0–16.0 °C for Pinot noir and 16.5–19.5 °C for Cabernet Sauvignon), to compare vintages, and to follow warming (Jones and colleagues, 2005, found about 1.3 °C of warming over 50 years across 27 premium regions). A number can start a decision, but the vineyard should be walked before it ends one.
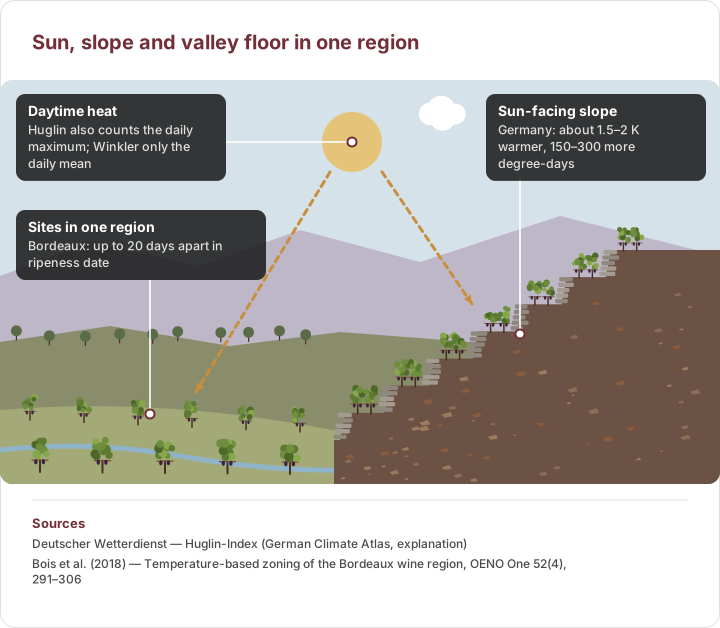
Diagram drawn from sourced data
A drawn region: the sun warms a sun-facing slope more than the valley floor. Sizes are illustrative; the numbers come from the German weather service and a Bordeaux study.
- Daytime heat — Huglin also counts the daily maximum; Winkler only the daily mean
- Sun-facing slope — Germany: about 1.5–2 K warmer, 150–300 more degree-days
- Sites in one region — Bordeaux: up to 20 days apart in ripeness date
Exercise 1: telling two climates apart
[Question]
Two regions have the same Winkler total. One has hot afternoons and cold nights; the other has mild days and warm nights. Which of the Winkler, Huglin and Cool Night indices could tell them apart, and why?
[Model answer]
Winkler uses only the daily mean, so both regions can score the same. Huglin adds the daily maximum, so the region with hot afternoons scores higher. The Cool Night Index uses the September minimum, so it separates cold nights from warm nights.
[Mark scheme (6 marks)]
• States that Winkler uses only the daily mean (2 marks)
• Explains that Huglin adds the daily maximum (2 marks)
• Explains that the Cool Night Index looks at night temperature (2 marks)
Exercise 2: a slope inside a region
[Question]
A vineyard faces south on a slope in a region whose Huglin value is about 1700. Why might the vineyard’s own value be higher, and what does DWD give for slopes in Germany?
[Model answer]
A regional value is an average, and sites inside a region differ; in Bordeaux ripeness dates differ by up to 20 days. DWD gives slopes facing south, south-west and south-east about 1.5–2 K more than flat ground, or 150 to 300 more degree-days between April and September, so the slope can sit above the regional value.
[Mark scheme (6 marks)]
• Explains that a regional value is an average that hides sites (2 marks)
• Gives the DWD figures of 1.5–2 K and 150–300 degree-days (2 marks)
• Concludes that the slope may exceed the regional value (2 marks)
Data
- Daily temperature record
- A season window
- A formula
Index
- Winkler: daily mean
- Huglin: mean and maximum
- Seasonal mean, nights, water
Use
- Class on a published scale
- Compare with variety ranges
- Check the site and the vintage
Frequently asked questions
What is the Winkler index?
It is the sum, from 1 April to 31 October, of the daily mean temperature above 10 °C (50 °F), published by Amerine and Winkler of UC Davis in 1944. It sorts places into Regions I to V, from up to 2500 to above 4000 degree-days Fahrenheit.
How does the Huglin index differ from Winkler?
Huglin uses the average of the daily mean and the daily maximum above 10 °C, from 1 April to 30 September, and multiplies by a latitude coefficient. It therefore rises faster in places with hot afternoons.
Can one number describe a wine region’s climate?
No. Each index counts different things, and sites inside a region differ: in Bordeaux ripeness dates vary by up to 20 days. Indices are a first filter, not a verdict.
Sources
- Amerine & Winkler (1944) — Composition and quality of musts and wines of California grapes, Hilgardia 15(6), 493–675
- OIV — Resolution OIV-VITI 423-2012: Huglin heliothermal index
- Tonietto & Carbonneau (2004) — A multicriteria climatic classification system for grape-growing regions worldwide, Agricultural and Forest Meteorology 124, 81–97
- Jones, White, Cooper & Storchmann (2005) — Climate Change and Global Wine Quality, Climatic Change 73, 319–343
- Jones — Climate and Terroir: Impacts of Climate Variability and Change on Wine (Geoscience Canada Reprint Series 9, 2006)
- Hall & Jones (2010) — Spatial analysis of climate in winegrape-growing regions in Australia, Australian Journal of Grape and Wine Research 16(3), 389–404
- Deutscher Wetterdienst — Huglin-Index (German Climate Atlas, explanation)
- Bois et al. (2018) — Temperature-based zoning of the Bordeaux wine region, OENO One 52(4), 291–306
- Peel, Finlayson & McMahon (2007) — Updated world map of the Köppen–Geiger climate classification, Hydrology and Earth System Sciences 11, 1633–1644